Skip to content
MSP Hub

HubX · Dashboards & reports

Dashboards per book. Reports that arrive by email.

Build dashboards from chart and table widgets for the billing subscription selected in the header, and share them. Eleven reports cover revenue, profit and savings, and operations; any of them can be scheduled for email delivery.

Actual HubX UIDemo data
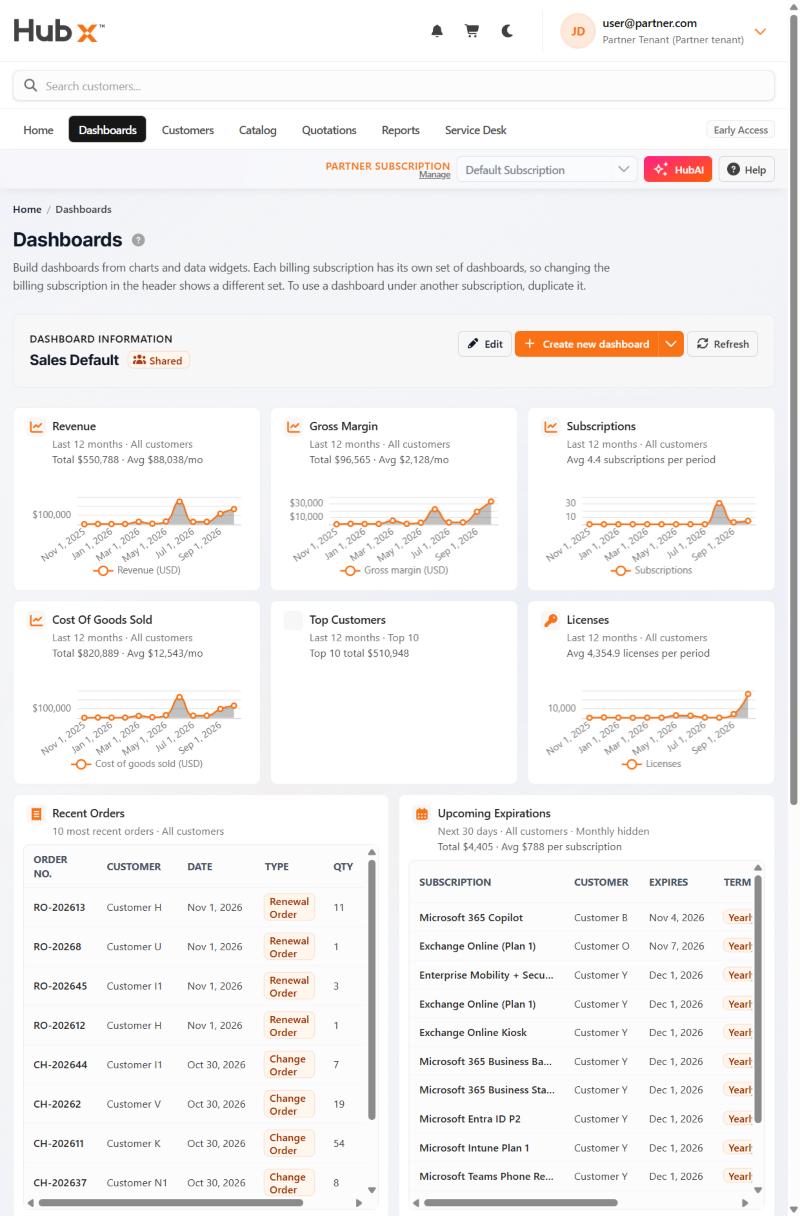
HubX dashboards: a sales dashboard with revenue, gross margin, subscriptions, cost of goods sold, top customers and licenses charts, plus recent orders and upcoming expirations tables. Demo data.
Dashboards. A shared dashboard of chart and table widgets for the billing subscription selected in the header. Captured November 2026. Close-up of part of the screen.

Dashboards

Actual HubX UI · Demo data · Captured November 2026

HubX dashboards: a sales dashboard with revenue, gross margin, subscriptions, cost of goods sold, top customers and licenses charts, plus recent orders and upcoming expirations tables. Demo data.
Actual HubX UIDemo data
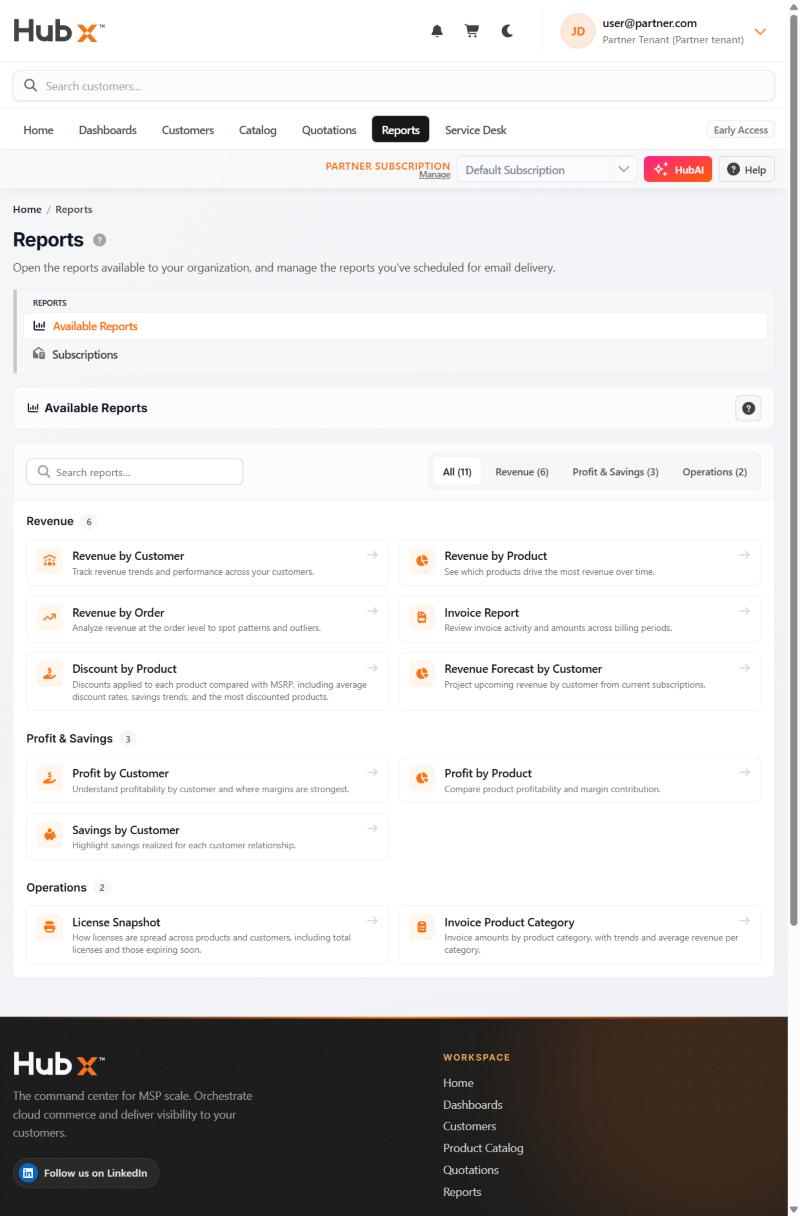
HubX reports: available reports grouped as Revenue (6), Profit & Savings (3) and Operations (2), each with a one-line description. Demo data.
Reports. Eleven reports in three groups (revenue, profit and savings, operations), each described on screen. Captured November 2026. Close-up of part of the screen.

Reports

Actual HubX UI · Demo data · Captured November 2026

HubX reports: available reports grouped as Revenue (6), Profit & Savings (3) and Operations (2), each with a one-line description. Demo data.

Reports

Eleven reports in three groups.

Revenue (six reports), profit and savings (three) and operations (two), each with a one-line description of what it shows.

  • Revenue by customer, product and order; invoice report; discount by product; revenue forecast by customer
  • Profit by customer and by product; savings by customer
  • License snapshot; invoice product category

Next step

See it with your own scenario.

Request a demo. The team replies by email to arrange a time.